
Insights
Insights charts what your agents did. Everything in it is computed from midna’s event log, so it only shows what really happened.
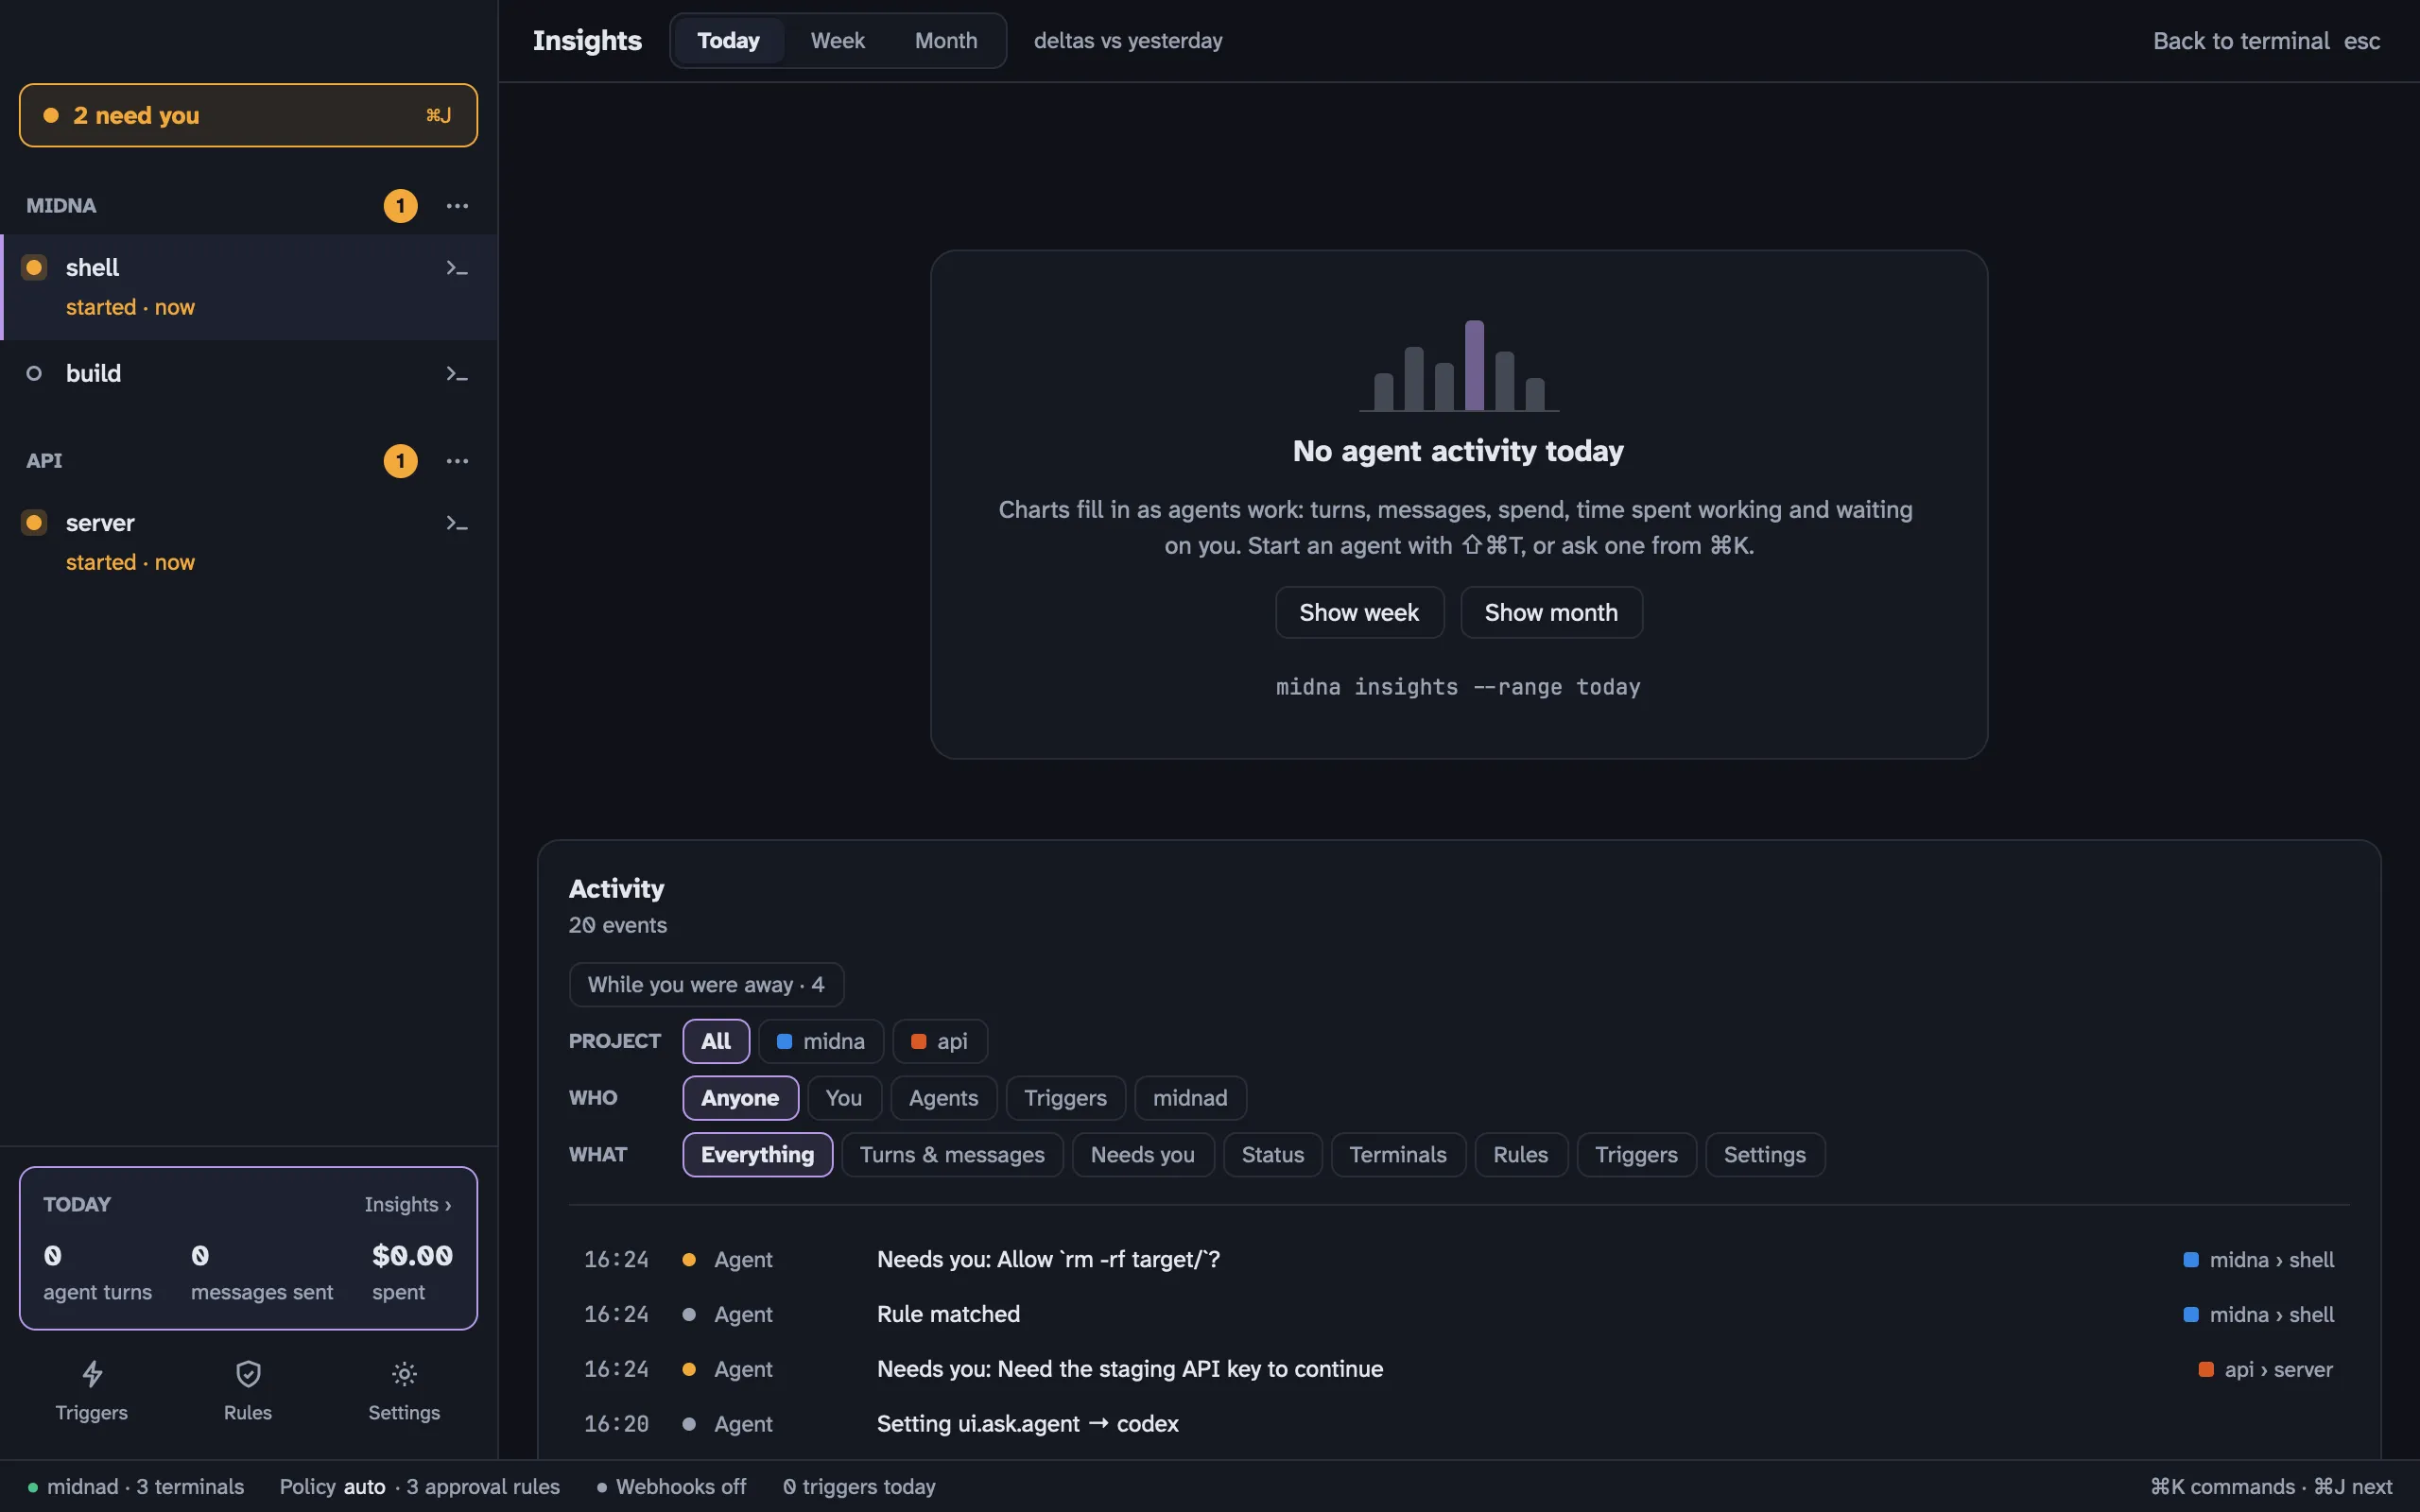
Open it from the Today card at the bottom of the sidebar, from ⌘ K, or with ⇧ ⌘ I. esc goes back to the terminal.
What it shows
Section titled “What it shows”Pick Today, Week or Month at the top. Each headline number compares with the period before.
- Agent turns: how many times an agent worked on something, stacked by project. Hourly for today, daily for a week or month. Hover a column for exact numbers, and click a project to filter the log.
- Messages: prompts you sent agents.
- Spend: Claude Code’s cost, from the status line midna gives it. Codex doesn’t report cost.
- Working vs waiting on you: per agent terminal, how long it worked and how long it sat waiting for you.
- Approvals and triggers fired.
The sidebar’s Today card shows today’s turns, messages and spend at a glance.
Activity
Section titled “Activity”Below the charts is the activity log for the range. Filter it by project, by who acted (You, Agents, Triggers, midnad) and by what happened (turns and messages, needs you, status, terminals, rules, triggers, settings). While you were away shows only what happened while midna wasn’t in front. Click a row from a terminal that’s still open to go to it.
From the CLI
Section titled “From the CLI”midna insights --range week --by projectmidna insights series spend --range monthmidna insights activity --limit 50